Chapter 4
§ 4-1 Related Rates
Consider the volume of a sphere, `V=4/3 pi r^3`. Suppose that you will with ballon with air
at a constant rate, `100" cm"^3/"s"`. How does the radius increase?

§ 4-2 Differentials
Consider the image below:

`f(x+h)~~f(x)+f'(x)*h` if h is "small."
§ 4-3 Extreme Values of Functions
- Define Absolute Maximums and minimums
- Define local/relative Maximums and minimums
- Explain how to find the critical points of a function over a closed interval.
- Describe how to use critical points to locate absolute extrema over a closed interval.
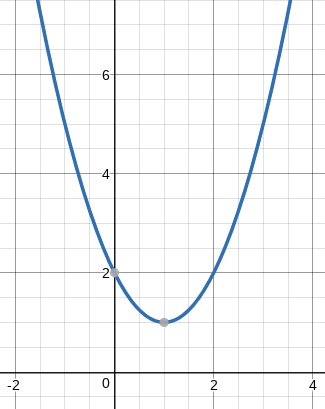
Consider `f(x)=x^2-2x+2`
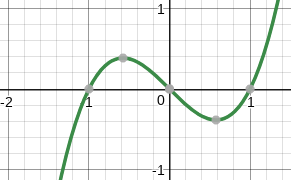
Consider `f(x)=x^3-x`
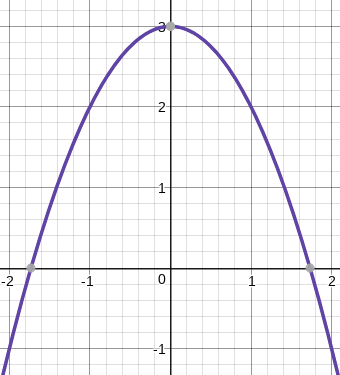
Consider `f(x)=3-x^2`
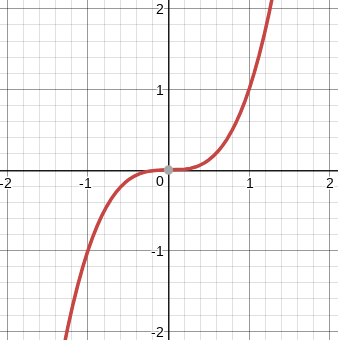
Consider `f(x)=x^3`
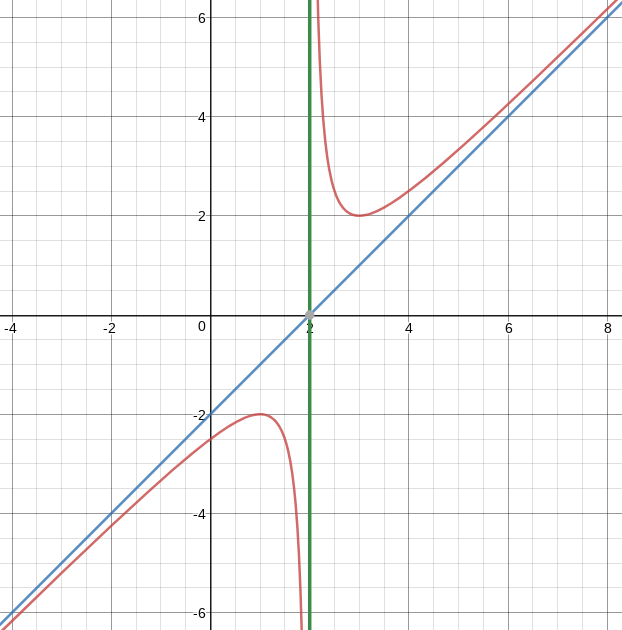
Consider `f(x)=(x^2-4x+5)/(x-2)`
Increasing, Decreasing, and the First Derivative
A function is increasing if `f(x_2)>f(x_1)` whenever `x_2>x_1`
This means that `f(x_2)-f(x_1)>0` whenever `x_2-x_1>0`, that is both differences are positive.
Now, the secant slope between those points `(f(x_2)-f(x_1))/(x_2-x_1)` is also positive.
`lim_(x_2 to x_1)(f(x_2)-f(x_1))/(x_2-x_1)=f'(x_1)` so the derivative/slope of the function
is positve.
Similarly, for the function is decreasing, then `f'(x)<0`.
Given continuity and the intermediate value theorem, if `g(a)>0` and `g(b)<0` then there is a `c in (a,b)` where `g(c)=0`
The first derivative of a function can potentially locate extreme vales for us.
§ 4-4 Mean Value Theorem
Let f be continuous over the closed interval `[a,b]` and differentiable over the open interval `(a,b)`.
Then, there exists at least one point `c in (a,b)` such that
`f'(c)=(f(b)−f(a))/(b−a)`.

Some important consequences of the mean value theorem are:
CONSTANT DIFFERENCE THEOREM
If `f` and `g` are differentiable over an interval `I` and `f′(x)=g′(x)` for all `x∈I`, then `f(x)=g(x)+C` for some constant `C`.
INCREASING AND DECREASING FUNCTIONS
Let `f` be continuous over the closed interval `[a,b]` and differentiable over the open interval `(a,b)`.
- If `f′(x)>0` for all `x∈(a,b)`, then `f` is an increasing function over `[a,b]`.
- If `f′(x)<0` for all `x∈(a,b)`, then `f` is a decreasing function over `[a,b]`.
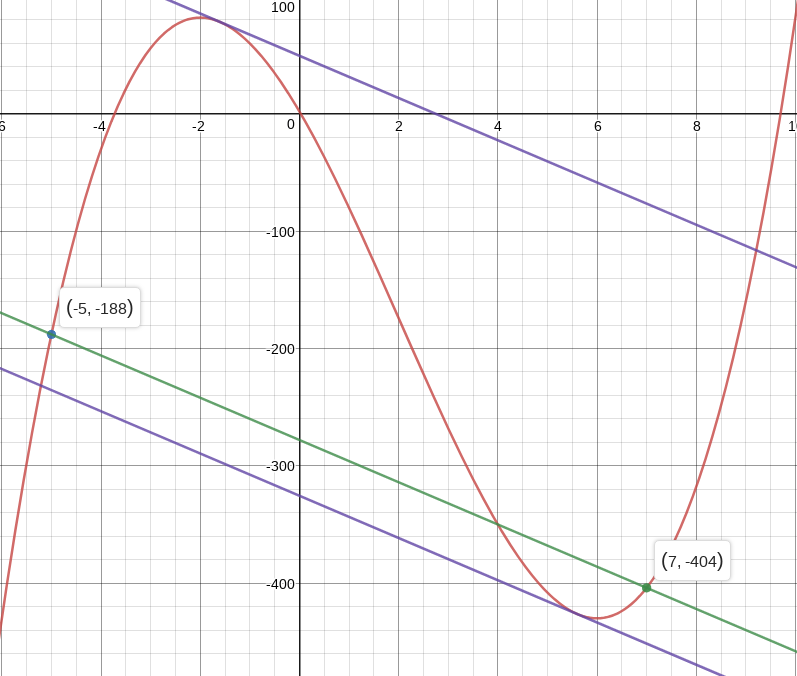
Consider `f(x)=2x^3-12x^2-72x+2` on the closed interval `[-5,7]`
Desmos Graph
§ 4-5 Shapes of Curves
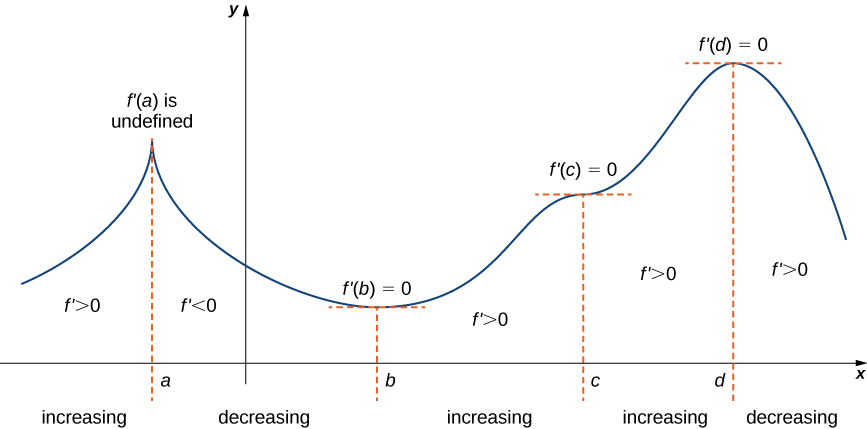
- Explain how the sign of the first derivative affects the shape of a function’s graph.
- State the first derivative test for critical points.
- Use concavity and inflection points to explain how the sign of the second derivative affects the shape of a function’s graph.
- Explain the concavity test for a function over an open interval.
- Explain the relationship between a function and its first and second derivatives.
- State the second derivative test for local extrema.
The First Derivative Test
Suppose that `f` is a continuous function over an interval `I` containing a critical point `c`. If `f` is differentiable over `I`, except possibly at point `c`, then `f(c)` satisfies one of the following descriptions:
- If `f′` changes sign from positive when `x < c` to negative when `x > c`, then `f(c)` is a local maximum of `f`.
- If `f′` changes sign from negative when `x < c` to positive when `x > c`, then `f(c)` is a local minimum of `f`.
- If `f'` has the same sign for `x < c` and `x > c`, then `f(c)` is neither a local maximum nor a local minimum of `f`.
The Second Derivative: Desmos Example of Changing Slopes on a Curve.
§ 4-6 Limits at Infinity and Asymptotes
- Calculate the limit of a function as x increases or decreases without bound.
- Recognize a horizontal asymptote on the graph of a function.
- Estimate the end behavior of a function as x increases or decreases without bound.
- Recognize an oblique asymptote on the graph of a function.
- Analyze a function and its derivatives to draw its graph.